Good Friday, everyone. Our much-anticipated Breeders’ Cup/Halloween Weekend is kicking off with some amazing weather. This nice weather will carry us into much of Halloween before showery changes move in to begin the month of November.
Temps out there today generally hit the 70s with a mix of sun and clouds. Those clouds increase from southwest to northeast later in the day and really thicken as we go into our Halloween Saturday. These clouds are ahead of the first system set to impact us with showers later Saturday night into Sunday.
The future radar from the Hi Res NAM shows the showers impacting the region with the greatest concentration across central and western parts of the state. This animation runs from 2pm Saturday through 7am Sunday…
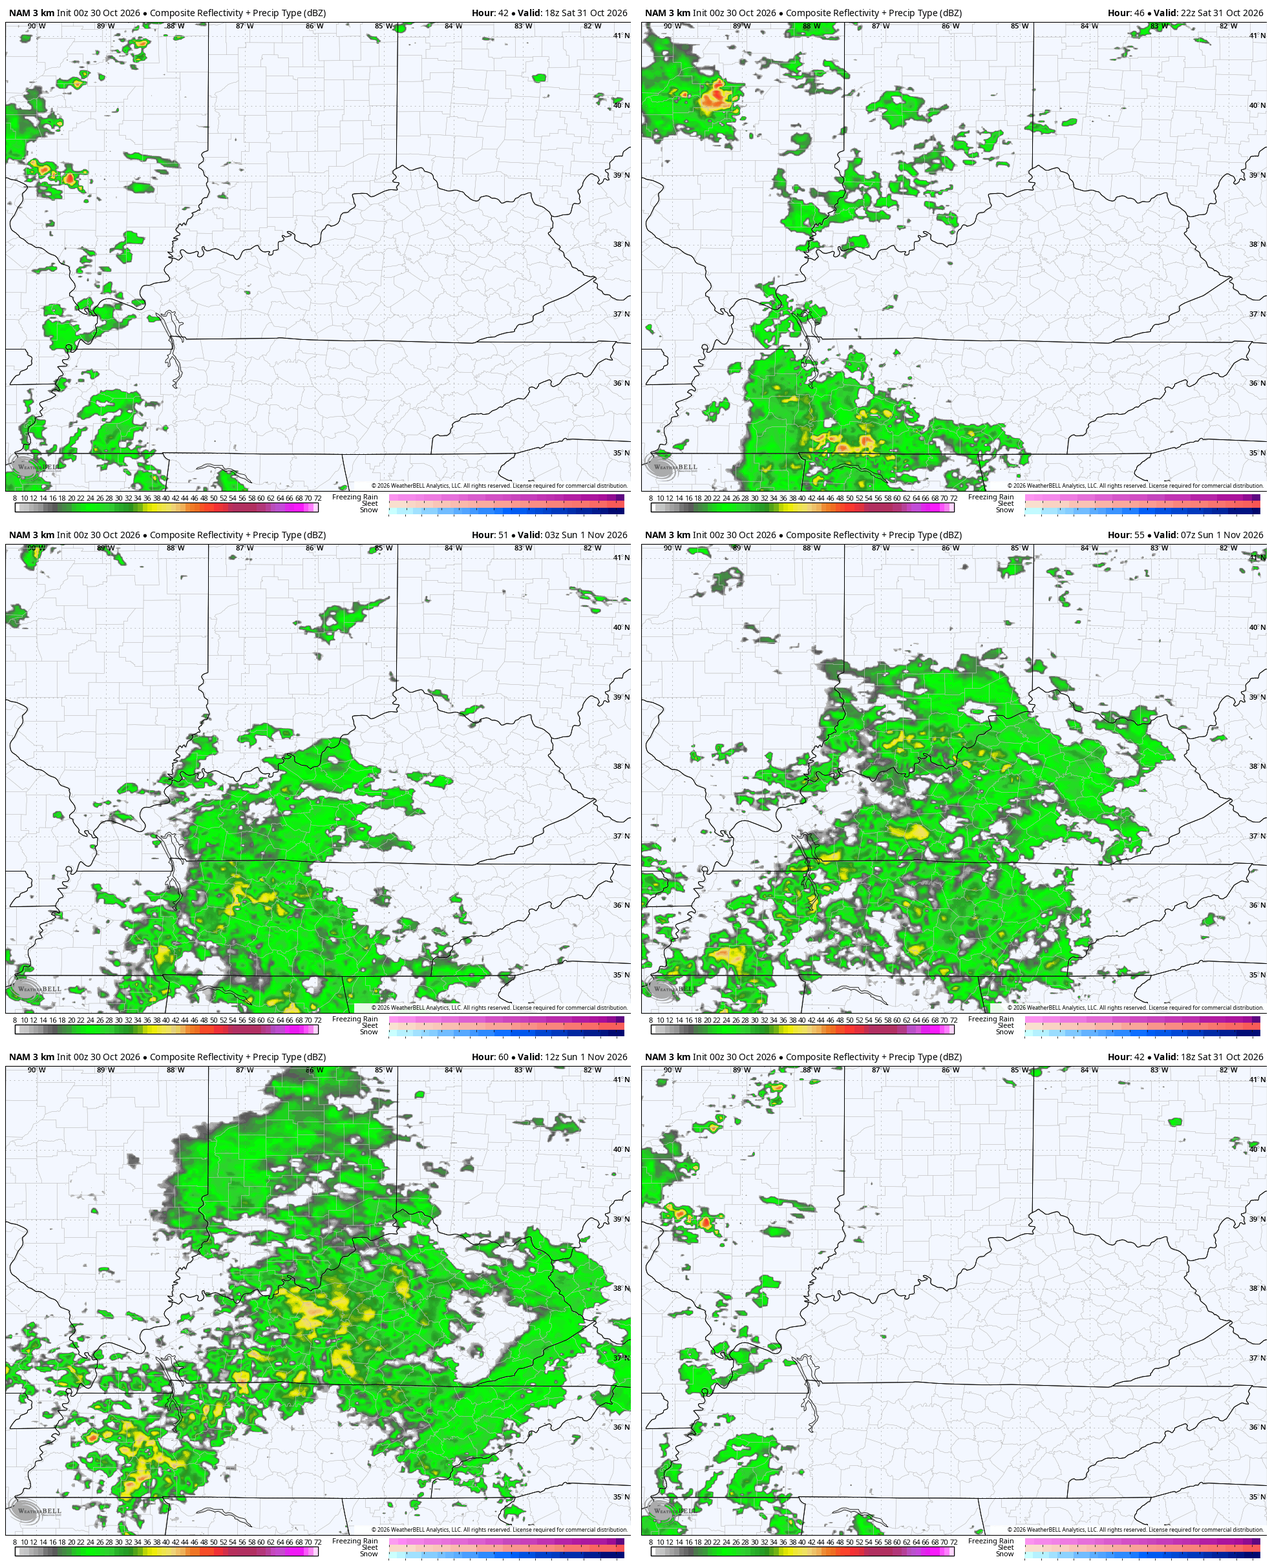
Showers will continue to be scattered across the region on Sunday with the best chance in the west and central. Temps will be noticibly cooler.
Lingering showers move away early Monday as a strong southwest wind boosts temps back up into the 70s for Election Day Tuesday. This is ahead of the slow-moving big time storm system set to spin through here for the middle and end of the week.
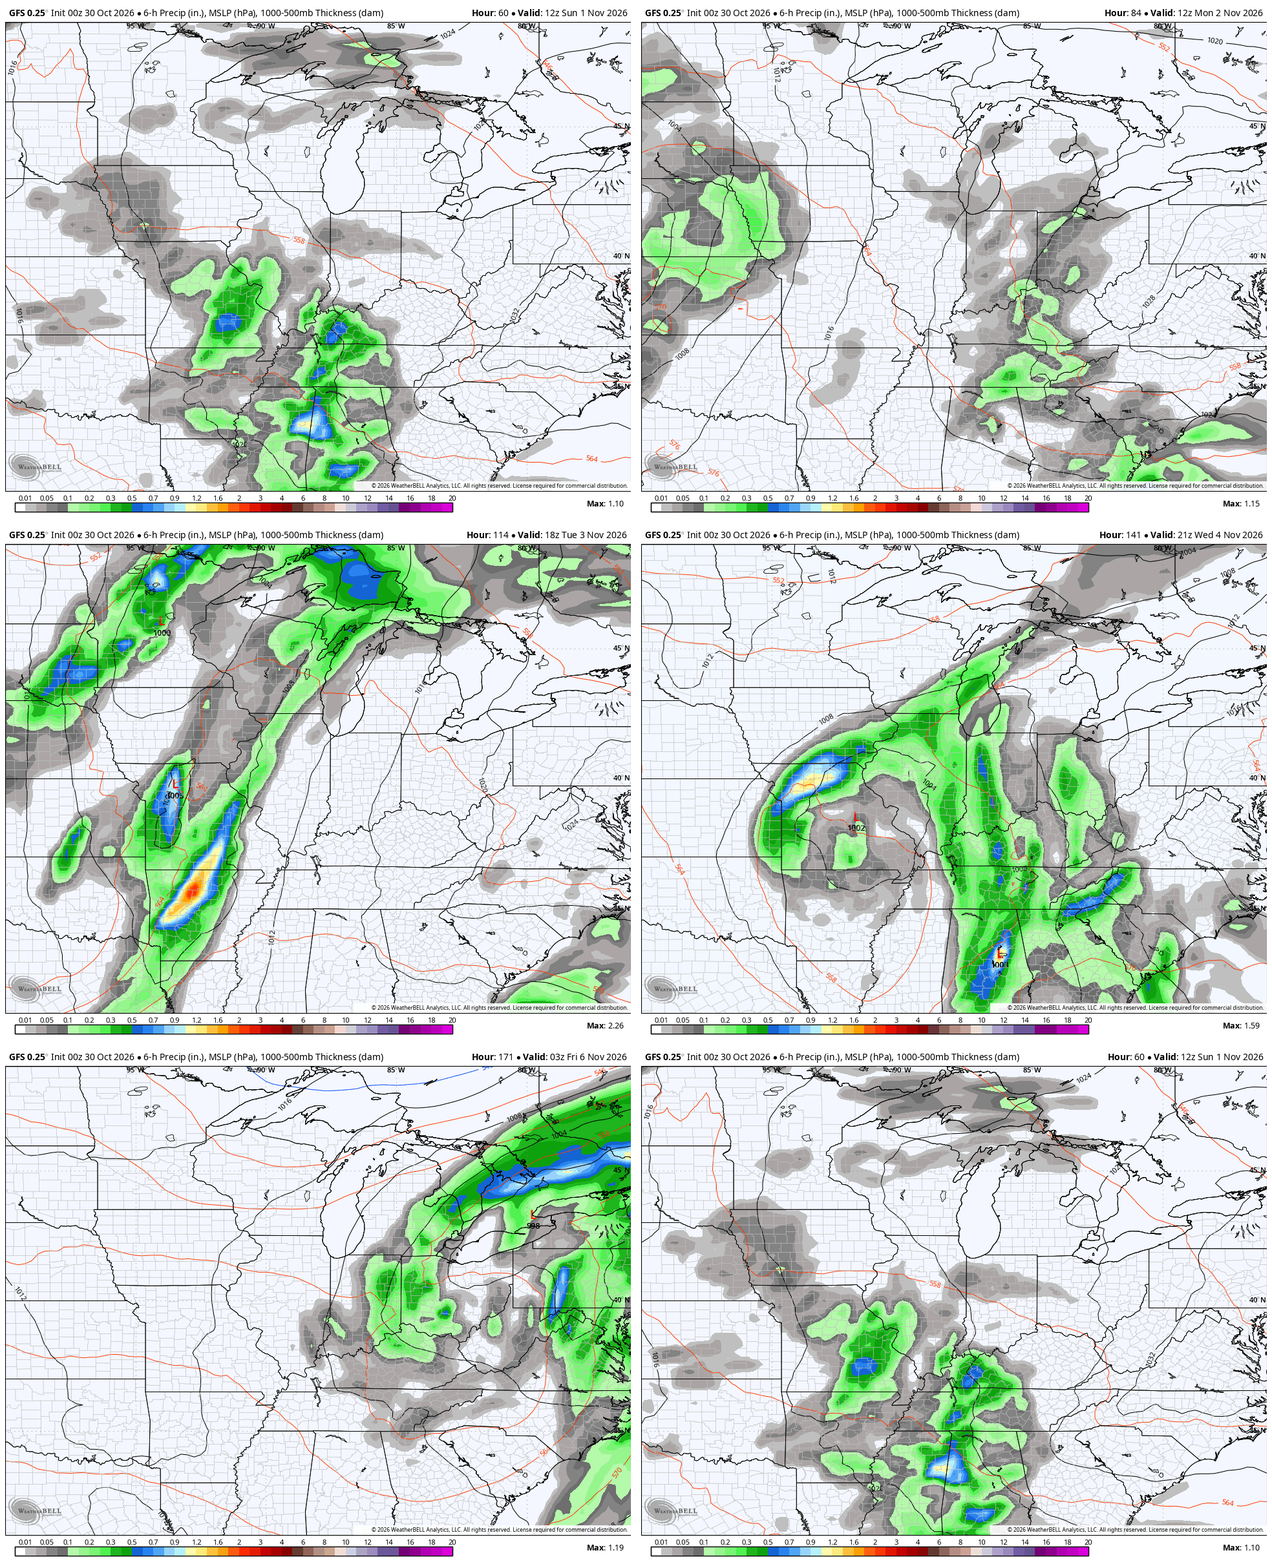
The timing on this continues to be a work in progress, but we are finding the models looking more similar than before. That’s some progress, at least.
The GFS is the quickest getting this in here with rain and storms arriving late Tuesday night and continuing through Thursday night and Friday morning…
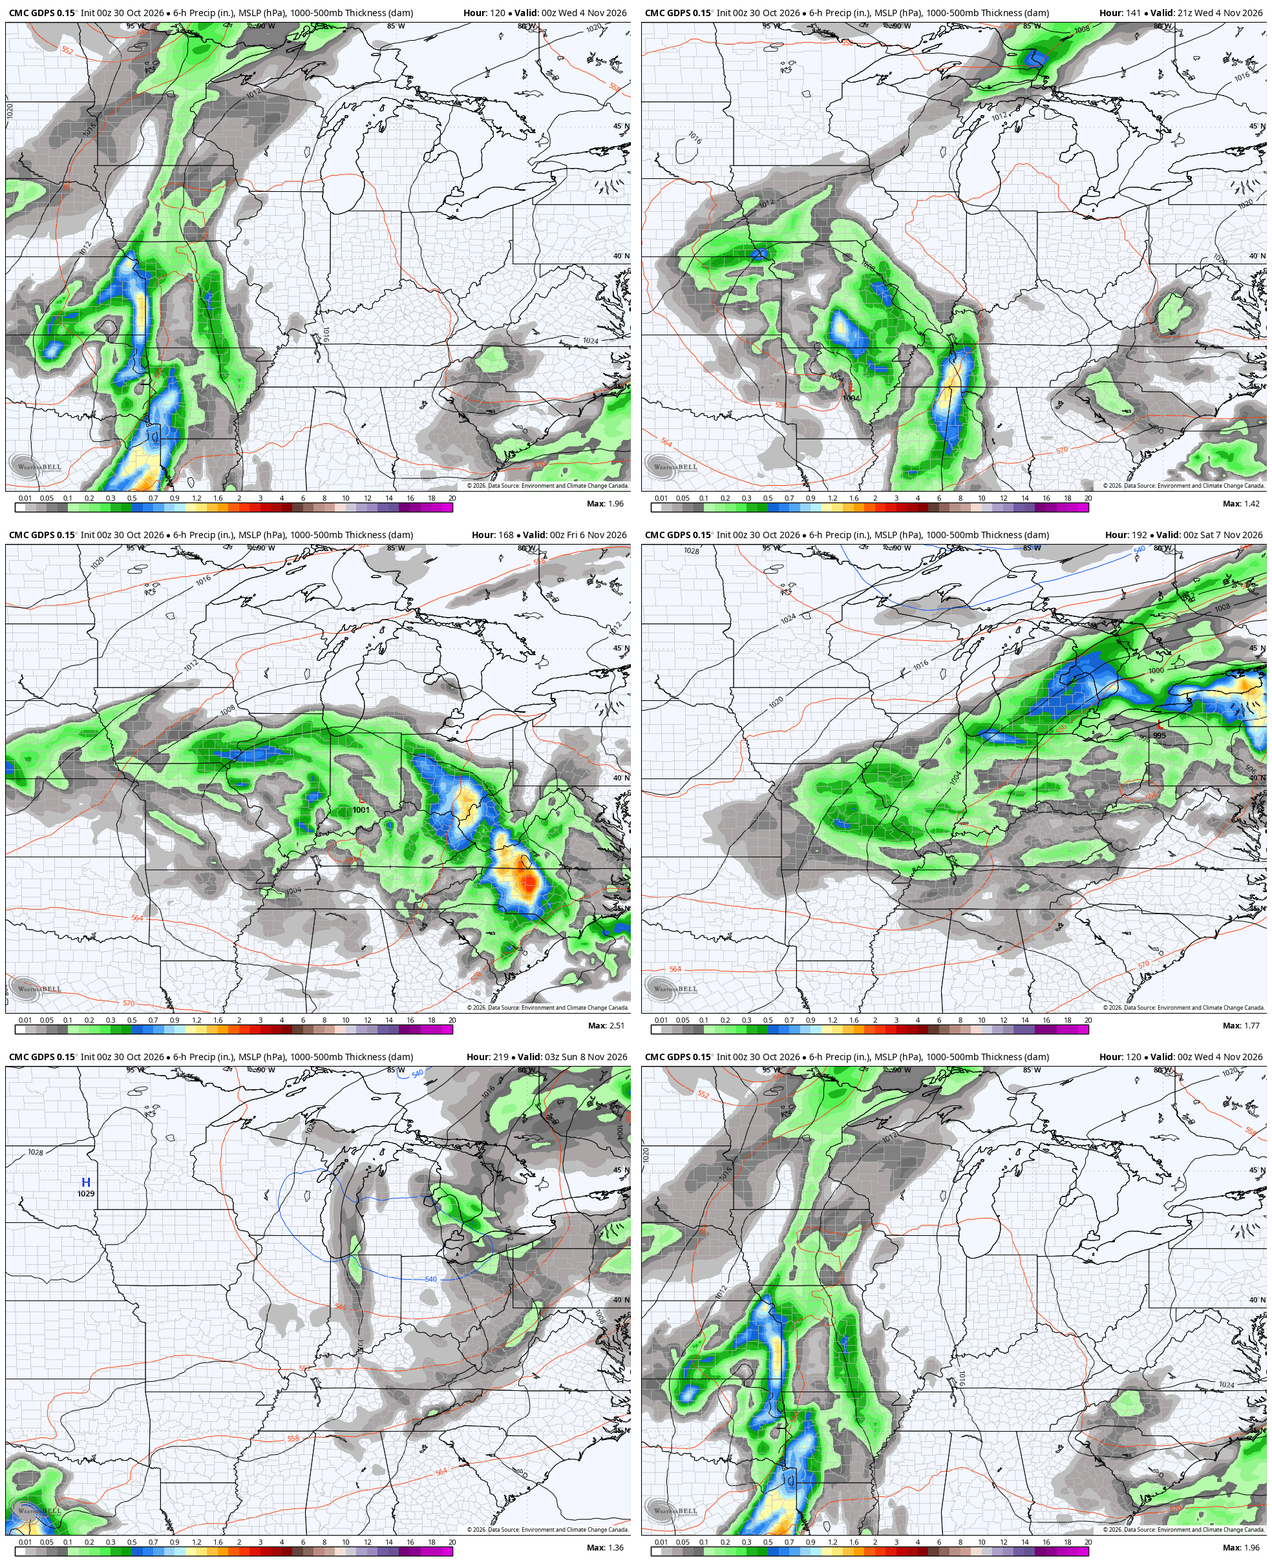
The Canadian really couldn’t find much of a storm system in prior runs, but the latest run has the storm and is really slow-moving with it. This brings the rain in late Wednesday and keeps it around through next weekend…
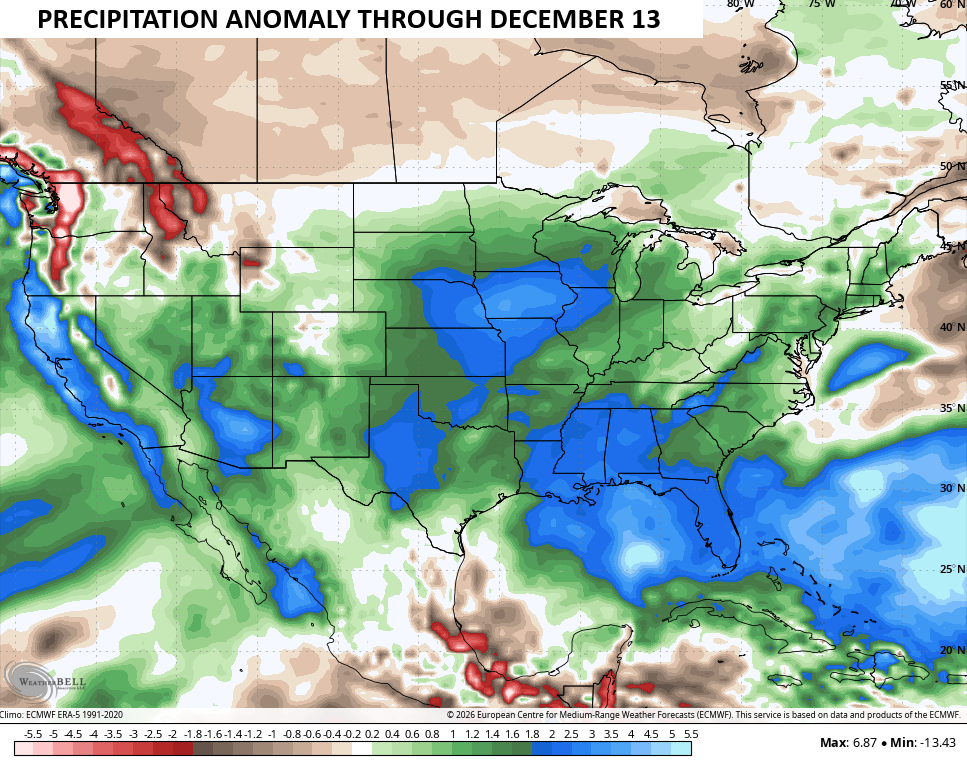
This kicks off a very active setup that takes us through November into, at least, the first half of December. The EURO Weeklies show well above normal precipitation through this period…
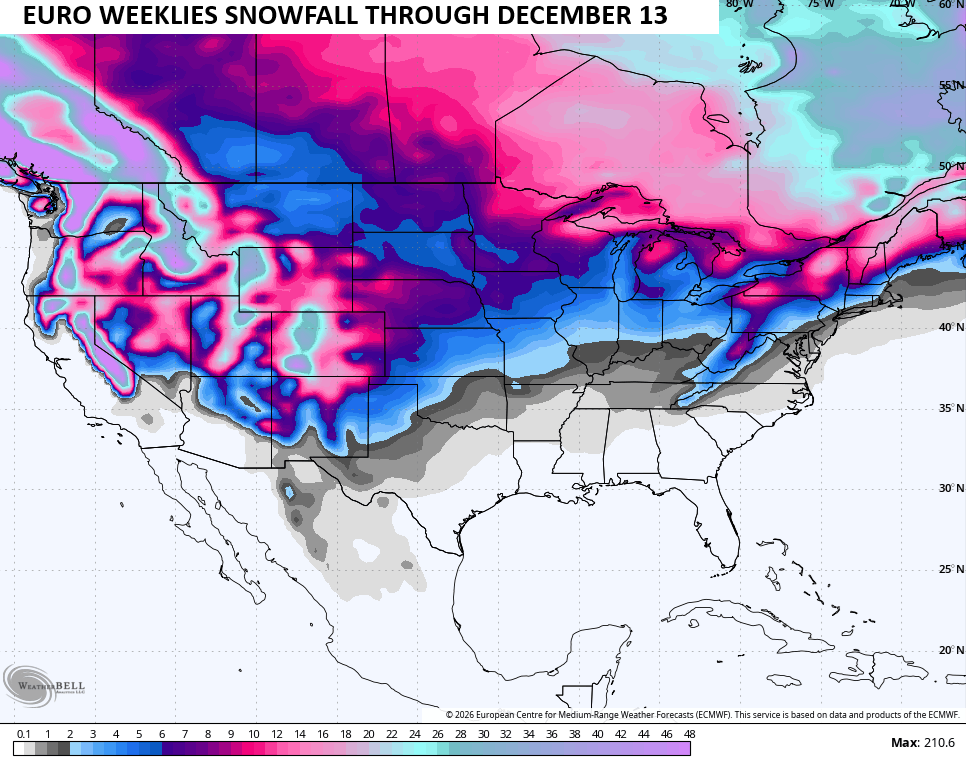
Some of this will likely be in the form of snow, with the chance for some early season flakes showing up across our region during the second half of November. Here’s the snow map from the Euro Weeklies during this same time period…
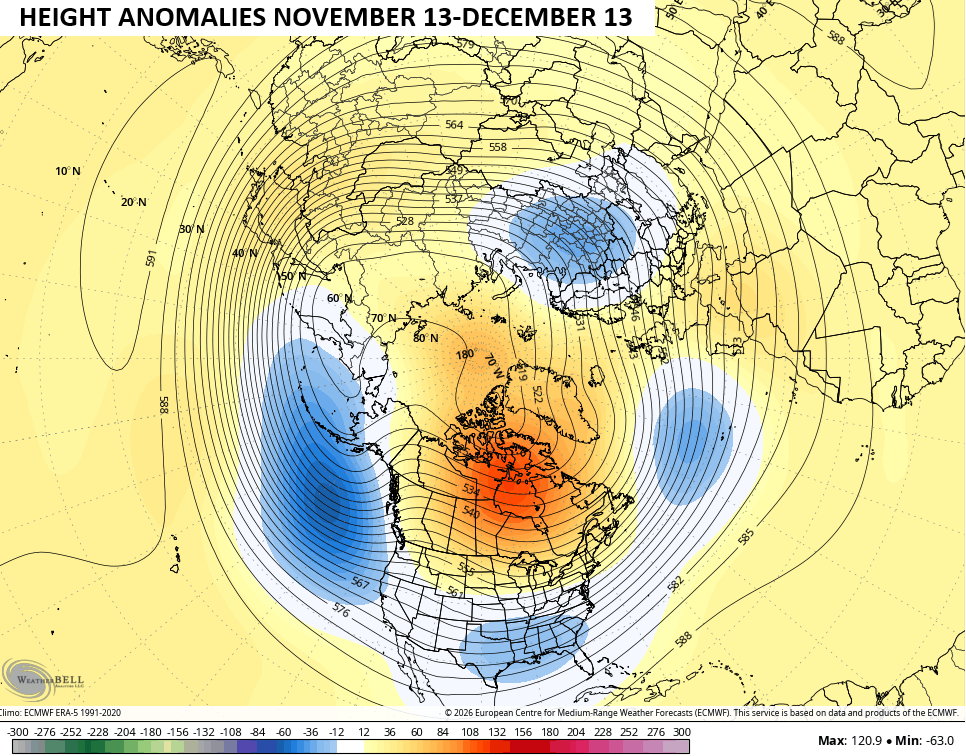
The 500mb height anomaly map from mid-November to mid-December looks a lot like what many of the seasonal models have been forecasting for a while. This map shows the entire Northern Hemisphere and firmly has the highest anomalies across Canada into the arctic with lower heights under that across the southern half of the US…
Have a great day and take care.
