Good Monday, folks. Our new work week starts off on a November look and feel and will end on a November look and feel. That’s right, another massive blast of the 11th month is on the way for the end of the week and weekend. It will also be accompanied by a big fall storm system. I’m also looking at the current El Nino in a loaded post.
Buckle up and let’s get after it.
Let us begin with the current taste of November before we roll toward the next November dish.
Highs today are in the 50s across western and central Kentucky with upper 40s to low 50s as good as it gets across the east and southeast. Clouds will be common with a gusty northerly wind continuing.
Something else continuing is the showers dropping through here. This is coming from north to south in many cases and will make for a dreary day from time to time. No, it’s not a washout of a day with a lot of dry hours showing up, but the showers will be out there.
Whatever is out there will show up on our radars…

A lingering shower or two hangs around into Tuesday, especially in the east. The west sees much better weather with highs 60-65. The east will be in the 50s again.
Wednesday is the pick weather day of the week with sunshine and 60s. Enjoy it!!
The next system quickly digs in here later Thursday as a massive trough engulfs the eastern half of the country through the weekend. With so much energy dropping into the east, the models are, understandably, struggling with placement of this…
GFS
CANADIAN
This brings very gusty winds, chilly temps and rain into the region.
As we rapidly approach the cold weather season, it’s time for us to check on the El Nino that continues to blossom in the equatorial waters of the Pacific Ocean.
Here’s a current look at the ocean temp anomalies from across the world…
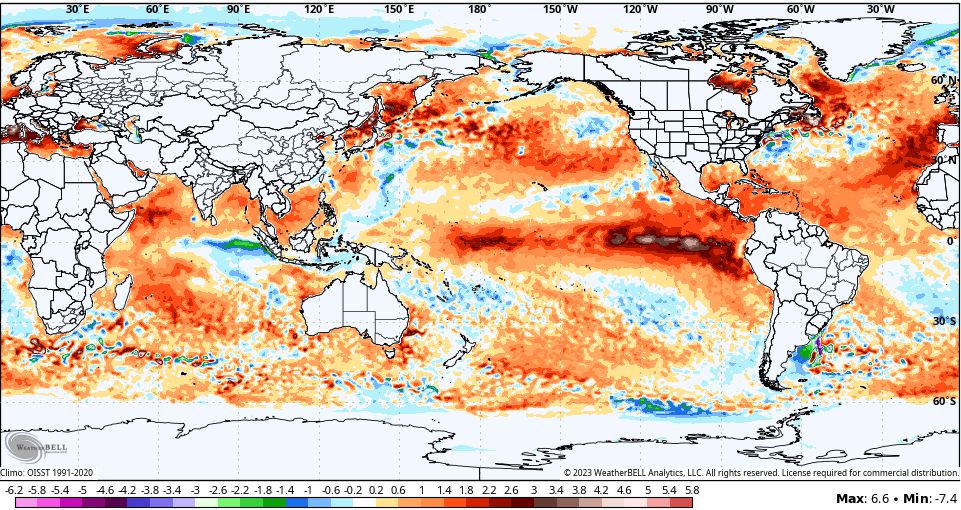
Notice how all bodies of water are warmer than normal. That likely plays a role in the response we get from this developing El Nino. You can clearly see those much warmer than normal water temps near the equator in the Pacific. There are 4 regions we watch in this area…
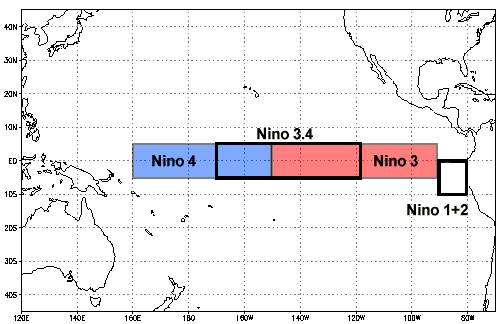
Historically, colder and snowier winters are associated with the warmest temp anomalies relative to normal showing up in region 3.4. When the warmest anomalies are in 1+2, things have a tendency to skew warm with less snow.
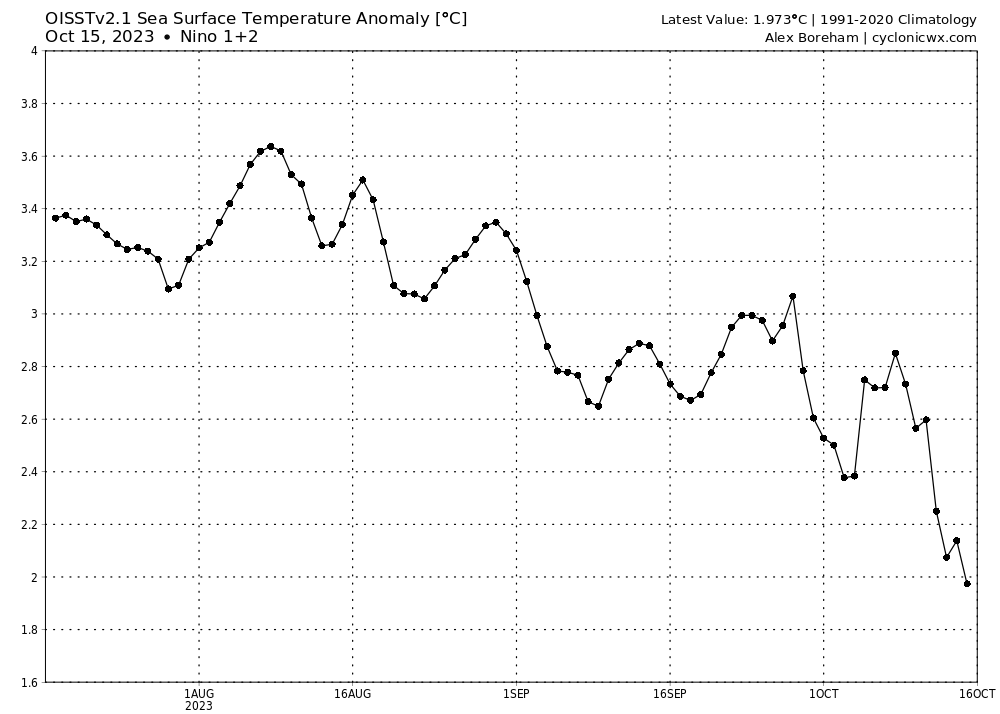
Nino 1+2 has been warmer than the rest of the regions through summer into early fall, but this appears to be changing. This graph shows how the temp anomalies in Nino 1+2 are now in a decline…
Nino 3.4, on the other hand, is climbing and is trying to become the warmest relative to average…
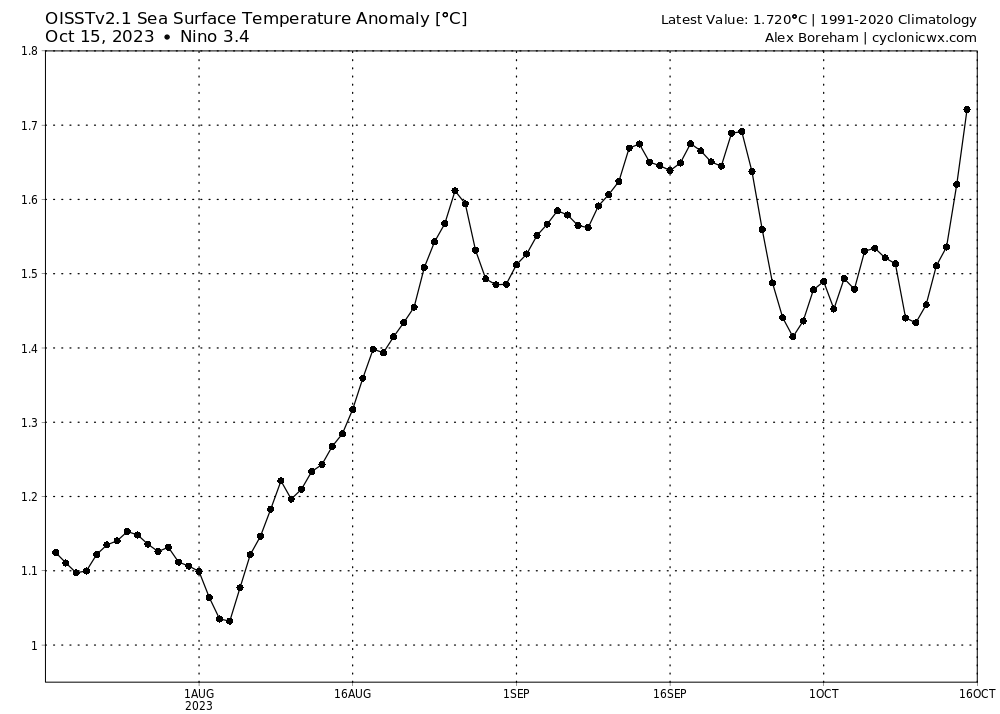
If the trendline continues, region 3.4 will soon have the warmest anomalies. This is something the seasonal models have been showing for a long time now and they continue to do so…
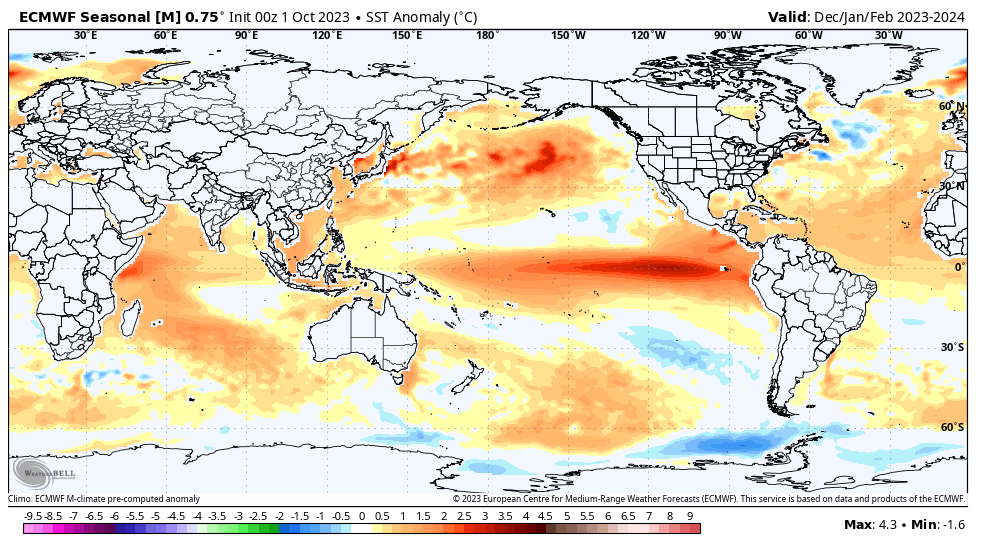
That’s the 3-month average anomalies for December through February. You can clearly see how those fall within Nino 3 and Nino 3.4…
I want to also talk about the strength of this El Nino since I’m seeing some circles label it as a Super Nino. It’s not and likely will not become one.
The best way to score what happens alone the equatorial Pacific is by using the Multivariate, ENSO Index or MEI for short. Why the MEI? This is from their site:
The MEI, which combines both oceanic and atmospheric variables, facilitates in a single index an assessment of ENSO. It especially gives real-time indications of ENSO intensity, and through historical analysis – provides a context for meaningful comparative study of evolving conditions.
Here’s a look at the MEI for two month intervals since 1979. El Nino is in red with La Nina in blue…
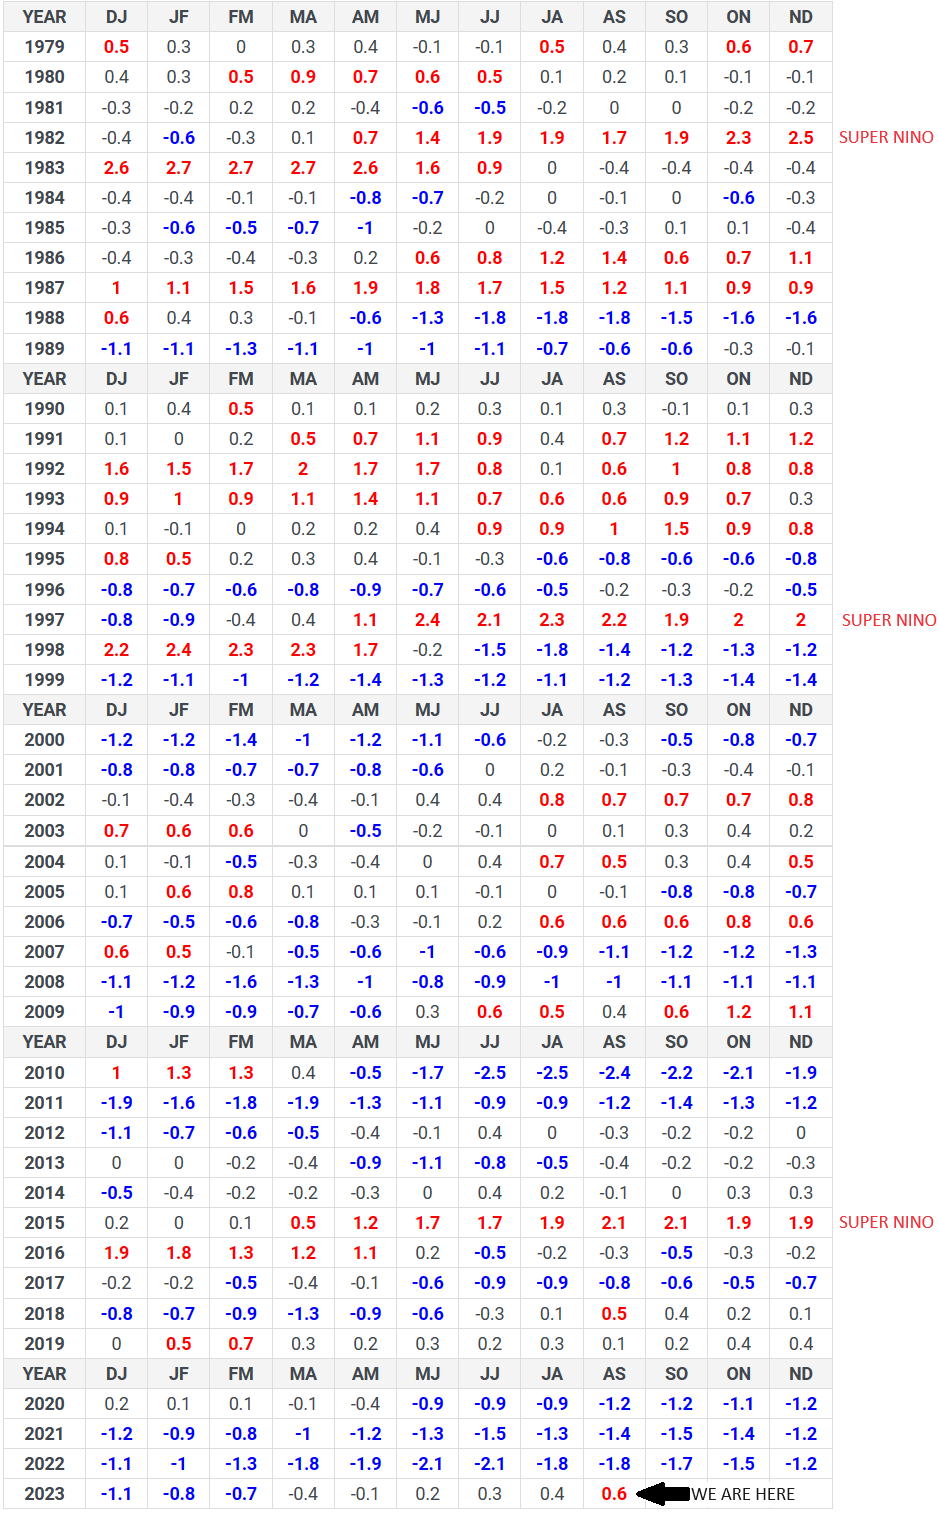
I’ve highlighted where we are now a 0.6 for the latest reading. I’ve also put a spotlight on the 3 Super Ninos on the list. 2015 was at 2.1 at this same point. 1997 was at 2.3 and 1982 was at 1.7.
So far, 2023 isn’t even in the same ballpark as those Super Ninos when it comes to the MEI. Even though we have impressive water temp anomalies, the atmosphere is not responding accordingly. This is something I’ve touched on several times over the past several months. Why? Because the overall warm waters across the rest of the world. It appears to me that these warm waters across the globe are raising the baseline for the atmospheric response from what’s going on in the equatorial Pacific. It’s just not acting the part because we don’t have such a stark oceanic temp difference as we used to.
Does that mean I’m right with my thoughts? No, but I did stay at a Holiday Inn Express last night. 😜
I’ll throw you another update later today, so check back. Make it a great one and take care.

As always, we shall see. I remain skeptical.
Thanks Chris. Very interesting Blog this Morning.
Two important points in today’s blog are the fact that we are settling into an El Niño 3 to 3.4, which is the preferred positioning for Winter weather in the Ohio/Tennessee Valley region, and the fact that we do not appear to be facing a Super El Niño is also good, since in terms of Winter weather around here, historically they have “not been good for business!”