Good Tuesday, everybody. It’s another chilly day for much of the region as we get set for a one day break in this November pattern. That’s right, we have another big chilly November weather maker rolling our way for the end of the week and weekend.
Today features more clouds for much of central and eastern Kentucky. Some peaks of sunshine will be possible, but the greatest clearing is in the west. Highs in the west are into the 60s with 50s elsewhere.
Winds won’t be quite as gusty, but will still be drilling in the chill. There’s still the chance for some mist or a few showers across the eastern half of the state. Your friendly radars are back by popular demand…

Wednesday looks REALLY nice with temps in the 60s and some clouds rolling in late in the day. These clouds are ahead of another potent storm system arriving later Thursday into Friday. Here’s a breakdown of the next system ahead:
- Winds rapidly increase Wednesday night and early Thursday as a cold front approaches from the west.
- This front slides In on Thursday with a few showers along and ahead of it. Highs are back in the 60s.
- The front slows down Thursday night and Friday as low pressure develops and rides along it. This brings an increase in rain to central and eastern Kentucky with lighter amounts for the west.
- Temps for Friday come way back down and likely stay in the 50s.
- As this storm system ramps up to our east and northeast Friday night and Saturday, we will watch for a clipper looking system to dive in with some more showers.
- Temps this weekend are very November-like once again with lots of 50s for highs in central and eastern Kentucky. The west will be quite a bit milder. Winds will also be gusty.
Here’s a look at our system via the GFS…
The new JMA seasonal forecast for winter is out and has one heck of a look for our region and the eastern half of the country. This is a 3 month 500mb height anomaly mean and it clearly shows a big trough in the eastern US…
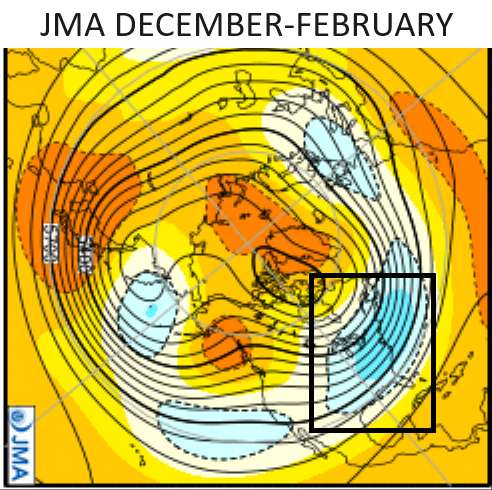
That’s not the greatest quality map, so I highlighted the eastern US. If you look at the overall pattern across North America, it shows a trough near the Aleutian Islands with ridging over Alaska down to the Pacific northwest. You can also see blocking around Greenland.
The above map is essentially a continuation of the pattern we’ve been seeing of late.
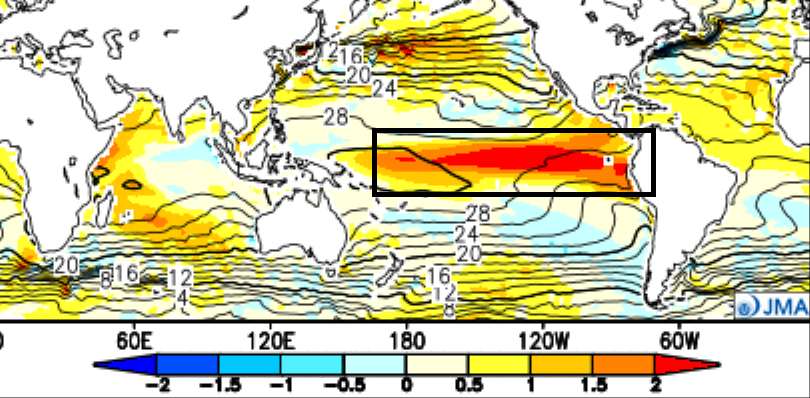
One of the other take aways from this run is how it also places the warmest waters of the El Nino into the 3.4 region we talked about yesterday…
The individual monthly 500mb forecasts only include December and January. The December mean shows our trough cutting from west to east under the blocking across the north…
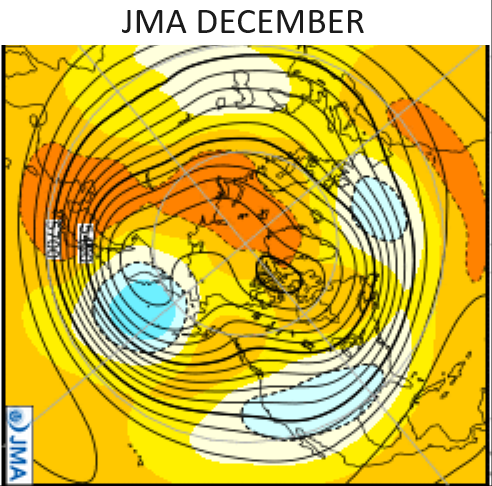
That would indicate a pretty active setup to go along with normal or a bit below normal temps.
The January mean is pretty eye-opening…
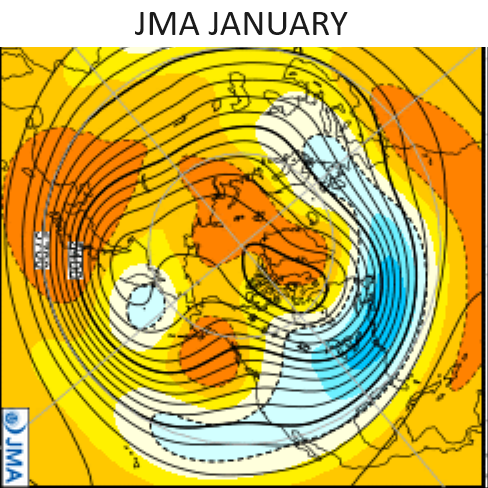
As always, we shall see.
I will have another update later today. Have a terrific Tuesday and take care.

Thanks Chris. Very interesting.