Good Monday to one and all. We’ve hit the midway point of December and with the first half of the month being about as cold and snowy as you could ever ask for around these parts. the overall pattern looks to be relaxing some with much more of a back and forth look to it through Christmas week.
The first 2 weeks of December have been as harsh as advertised and even surpassed my expectations when I first started talking about this potential in late Summer and early Fall. Historic amounts of snow have hit Louisville, Lexington and Covington at different points. The coldest temps for this early in the season in, at least, 15 years if not 30 years.
The pattern we talked about spitting out arctic shots coming from Alaska and the Yukon into our region verified. Look at the coldest temp anomalies over the past 14 days…
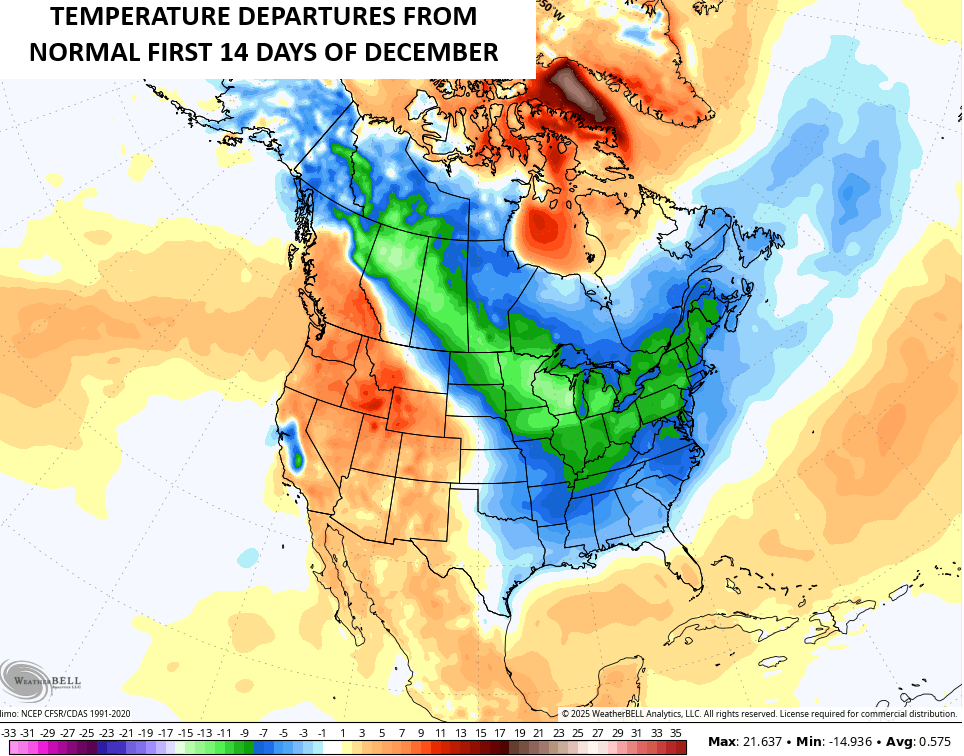
That’s some brutal stuff when you consider that’s the average of 14 days. Incredible.
This brutal pattern is beginning to relax over the next few days as we get a few days to thaw out. Temps spike, especially Thursday on a strong southwest wind. That wind is ahead of another strong cold front with a quick-hitting band of rain ahead of it and a temp crash and some flakes behind it.
Another weak front should follow that up later in the weekend…

Some snow showers and flurries may even try to put down some hit and run coatings on Friday as another shot of cold surges in. Watch the feels like temp tank from Thursday afternoon through Friday morning. Here’s the GFS…
And the Canadian during the same time…
This pattern bounces back for Christmas week with a few mild shots a good bet. Yea, the timing on that stinks but there’s the chance for a front or two to dig deeper into the east than the models currently think.
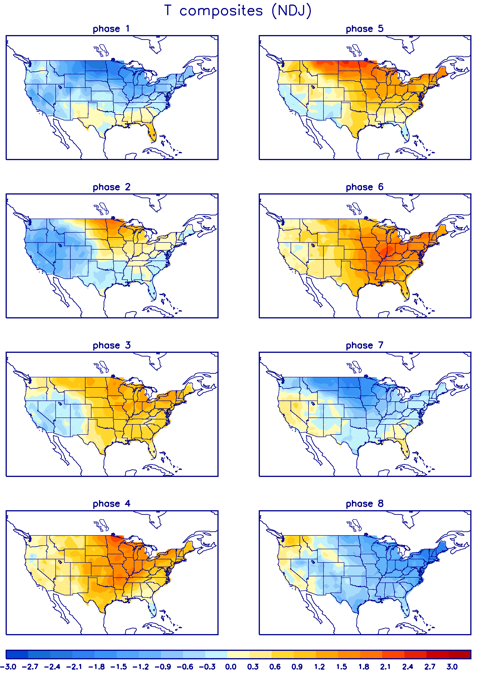
If we take a look at the latest forecasts of the Madden-Julian Oscillation, or MJO we find all the long range forecasts looking pretty similar. Now, these charts are really hard to decipher if you don’t know what you’re looking for. Let me give you a brief description… We have 8 phases of the MJO and those are numbered on the outer edge of the chart. The main squiggly line is the forecast line. The black part of the line is where the MJO has been. The colorful parts of the line show the forecast out in time. The numbers along the line show the corresponding dates for the next 2 weeks.
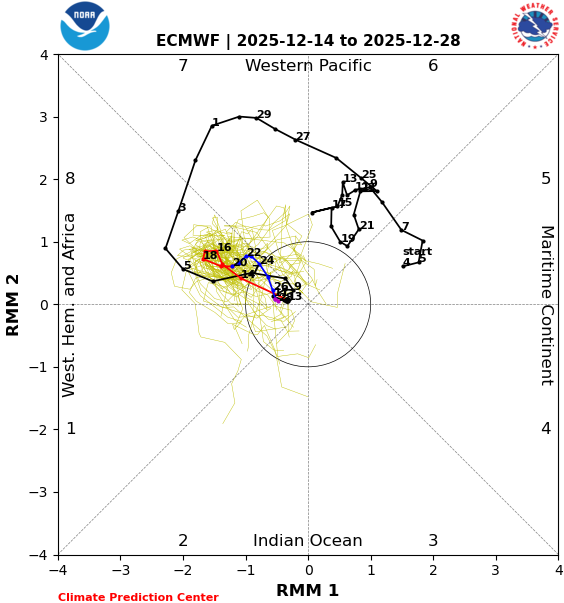
The next month…

You can see how the forecast is to keep the MJO in phases 7, 8 and 1… albeit weakly at times. The weather the MJO signal, the better the chance other factors influence the overall temperature pattern across the county, but those three phases are cold this time of year…
With a weaker MJO signature, we look at other possible contributing factors. For simplicity sake and because the GFS, to me, has been seeing the extended pattern a little better, we use the teleconnections from the GFS.
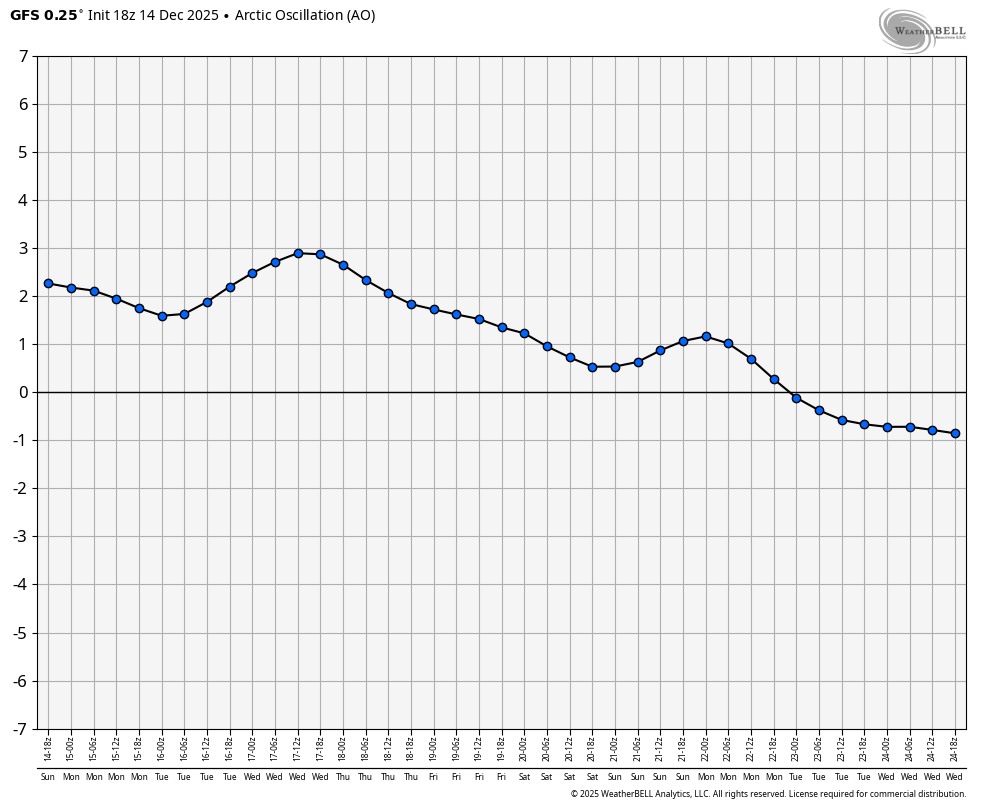
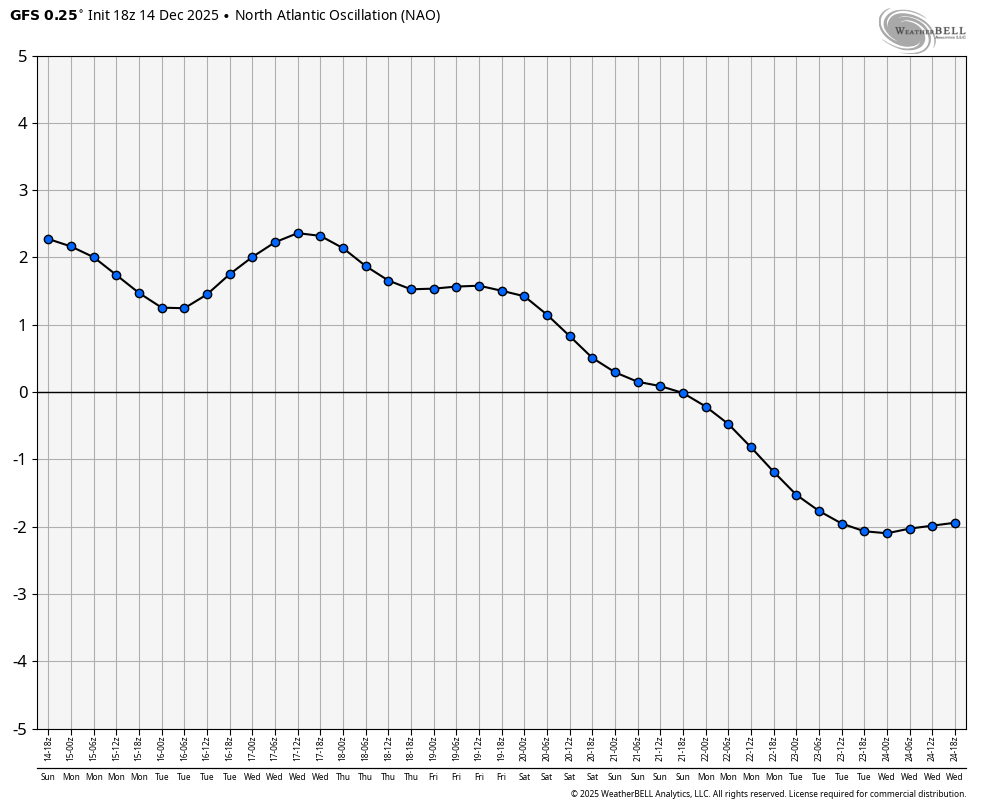
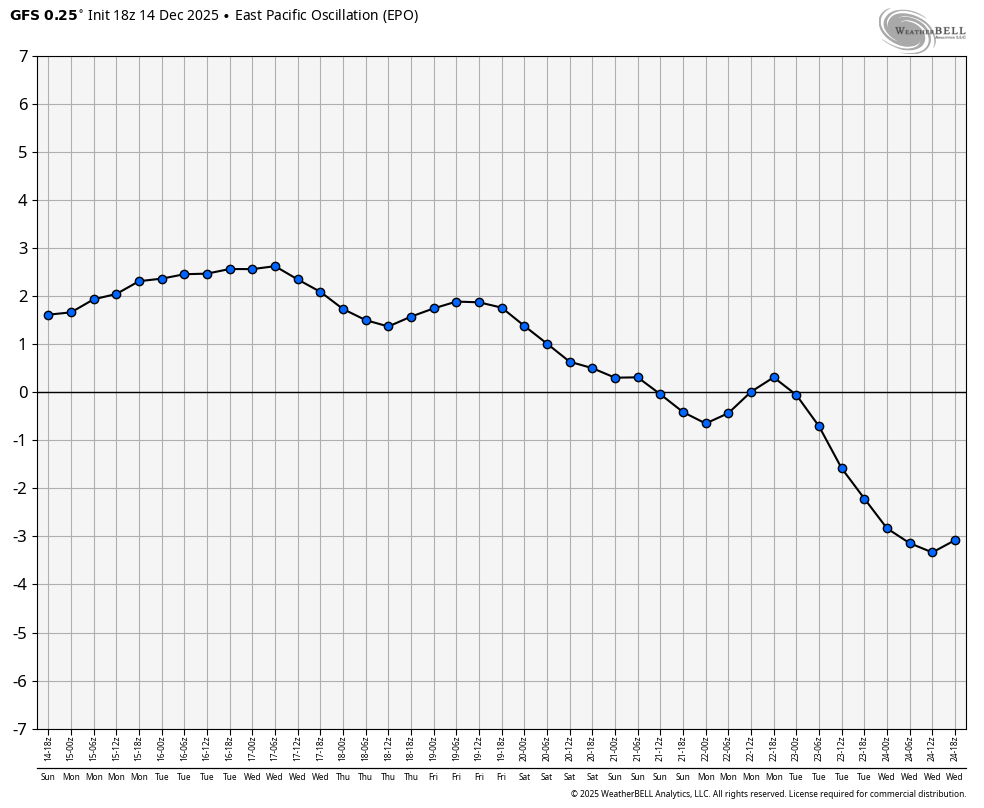
Supporting a change back to cold would be a -Arctic Oscillation, – North Atlantic Oscillation, – Eastern Pacific Oscillation and a -Western Pacific Oscillation…

The WPO has been extremely negative for a while now and that has been one of the main contributing factors to our incredibly cold start to December. It’s forecast to stay negative.
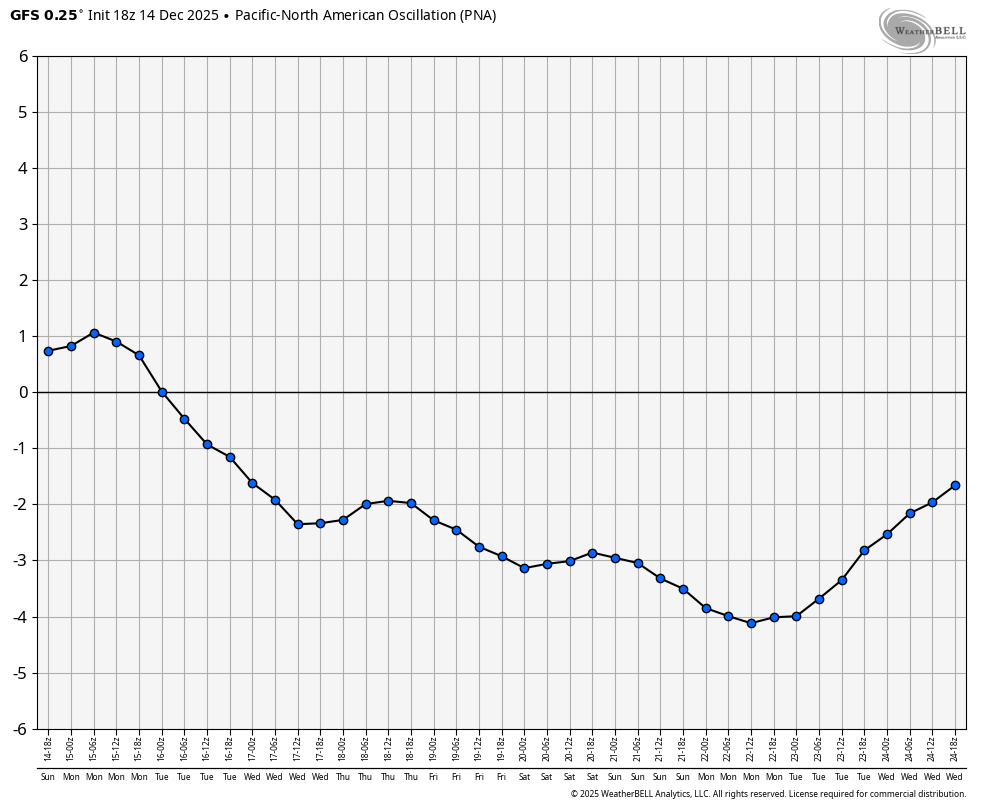
The one main signal going against a cold pattern returning is the -Pacific North American forecast to be strongly negative…
Granted, not all of the models have the exact same look with the various teleconnections and they do change a bit run to run. Combine that with a progged weak response from the MJO and you get a muddled message with lots of changes on the models. Make no mistake, the models are skewed warmer than normal right now but I’m wondering if they’re seeing the big picture correctly. We will see soon enough.
I’ll stop by with another update or two later today so check back. Have a great Monday and take care.

At least this cold snap hasn’t got much staying power
Warmth will rule over Christmas.
That’s warmth as compared to recent temps. The tank tops will be staying in the drawer for a while.
Chances for a ” White Christmas ” in Kentucky have always been low. My last one was in 2004 in Vanderburgh County, Indiana. Two feet of Snow on the ground, the deepest since the one in 1969. I’ve only seen three in my 74 years. The first one was in 1962, and only one where there was Snow on the ground on New Years Day 1970.
Thanks Chris. Here in Maple, we had a low temperature of 7 degrees. Coldest that I’ve seen it here since 2010. I think that was the year, but not sure. Very interesting information, and a Meteorological lesson on the MJO. Thank you for that, as I’ve been studying the MJO for sometime now. It’s difficult to keep all that information in mind at my age though. On the topic of Snows in your area the past few weeks, the La Nina jet stream was from a line south of Louisville to Lexington. The rest of the State was left out of the training Clipper Systems. If the La Nina jet stream ran through the state of Arkansas ( Northwest to Southeast, ) the whole State of Kentucky would have had a very Snowy, early December. We shall see what’s ahead for the rest of the Winter regarding both in temperature and precipitation ?